FAQ
What’s the best way to start using Spark?
Apache Spark has a steep learning curve. If you want to use one of the methods it’s recommended to first go through the documentation here. Then test some applications with small data sizes such that you can figure out memory requirements or how many compute nodes you will need to run an algorithm in a specified amount of time. If everything works out, try increasing the data size until you either encounter errors or everything works fine.
How can I check Apache Spark is executing correctly?
Sometimes jobs might fail, because you launched Spark’s compute nodes with too little memory, or a node lost its connection to the main worker, etc. When starting a cluster and running a method, it’s thus recommended to monitor what Spark is actually doing. You can do so by first starting a Spark cluster. We do that here using spark_hpc:
sparkcluster start --memory-per-executor 30000 \
                   --memory-per-core 5000 \
                   --walltime 4:00 \
                   --cores-per-executor 5 1
Having the cluster started, we can get information to which URL the Spark UI is listening to:
spark-cluster info

> ----- Cluster 0 -----
> Job id: 1756002
> Number of cores: 1
> Status: submitted
> Spark UI: http://lo-a2-029.leonhard.ethz.ch:8080
> Spark URL: spark://10.204.3.29:7077
In this case it’s http://lo-a2-029.leonhard.ethz.ch:8080. The Spark UI can
then be accessed from your desktop computer (by ssh port forwarding):
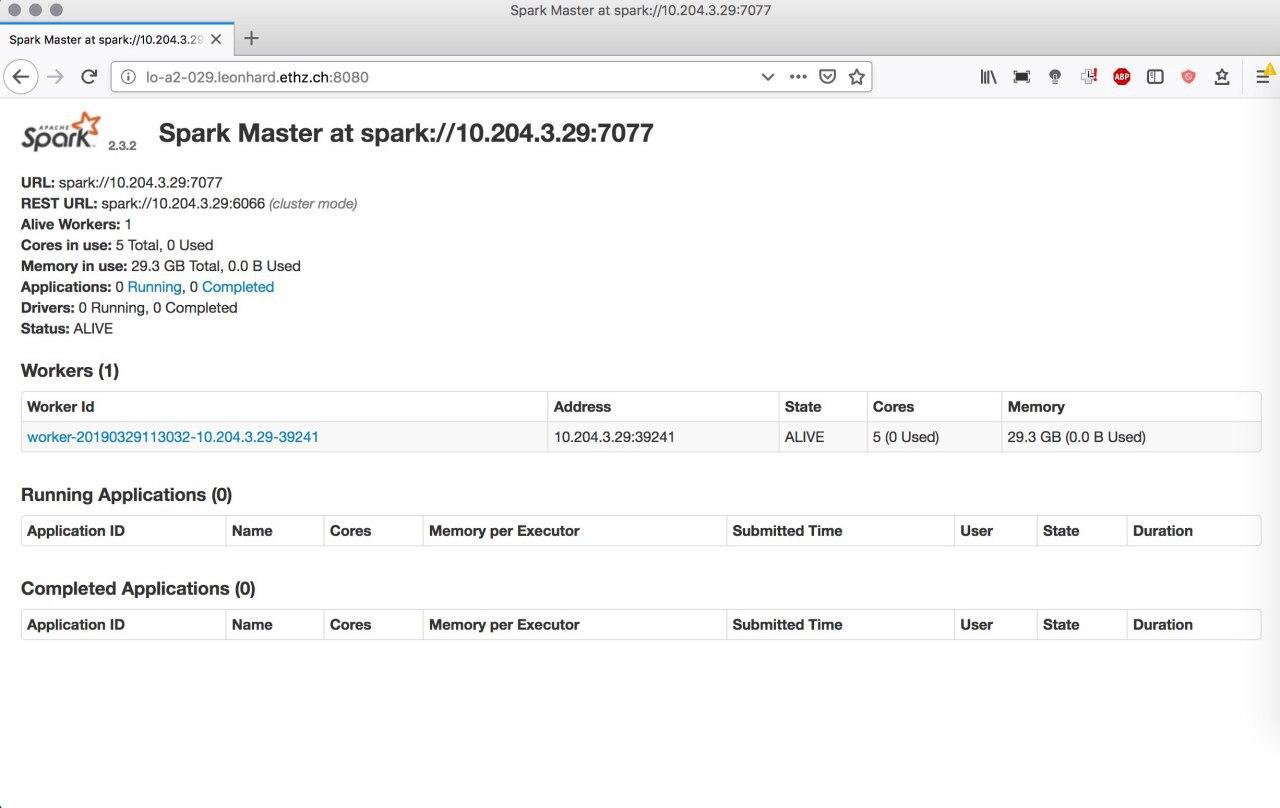
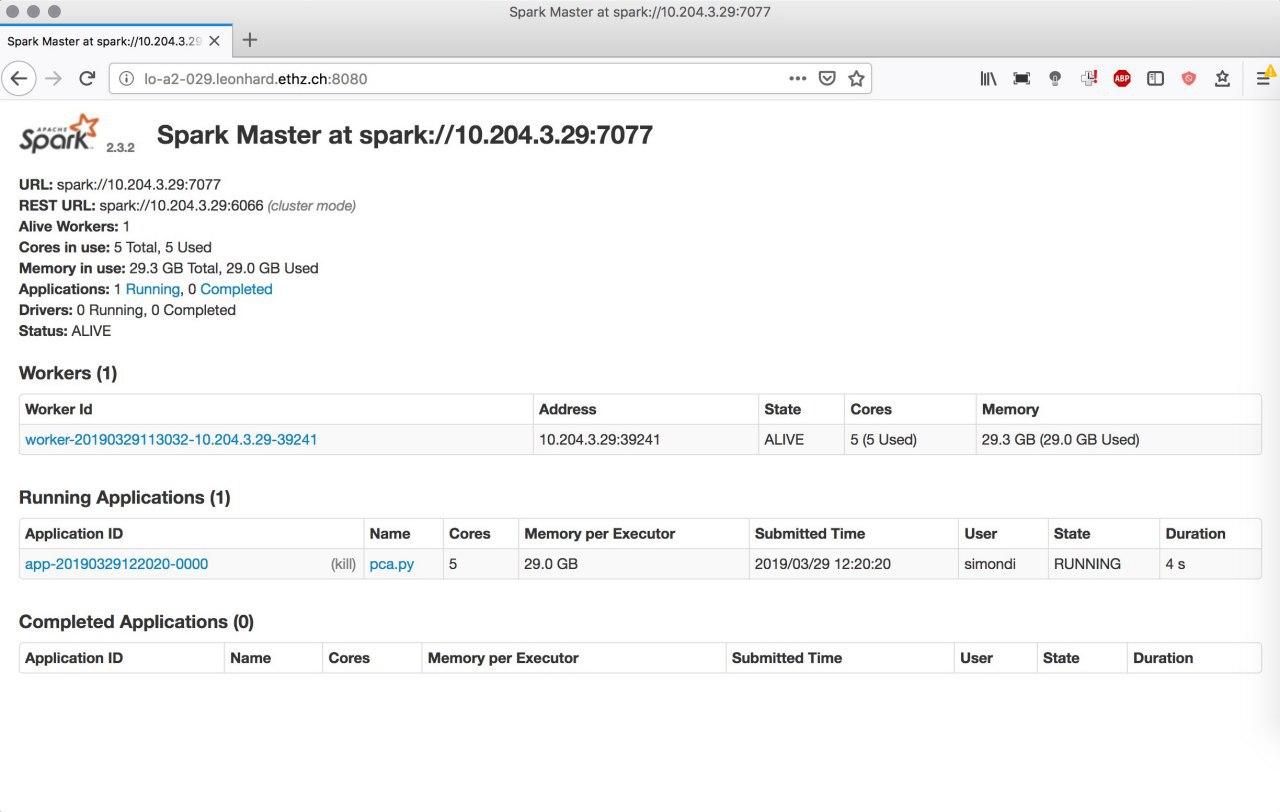
We then start a PyBDA application and can monitor what Spark is doing:
pybda dimension-reduction pca.yml spark://10.204.3.29:7077
We see that Spark started the application and runs it on 5 cores with 29Gb of memory:
How can I debug my config file?
If PyBDA exits for unkown reasons, it is often due to misspecified file paths,
wrong parameterization, etc. To see how PyBDA starts applications you can add
debug: true to your config file. This will print the Spark commands to stdout.
For instance, we use the following config file:
spark: spark-submit
infile: data/single_cell_imaging_data.tsv
predict: data/single_cell_imaging_data.tsv
outfolder: data/results
meta: data/meta_columns.tsv
features: data/feature_columns.tsv
dimension_reduction: pca
n_components: 5
clustering: kmeans
n_centers: 50, 100, 110, 120, 130, 140, 150, 160, 170, 180, 190, 200
regression: forest
family: binomial
response: is_infected
sparkparams:
  - "--driver-memory=3G"
  - "--executor-memory=6G"
debug: true
We then call PyBDA using the clustering subcommand and pipe the output to a
file. Grepping spark-submit gives us the calls Spark does.
pybda clustering data/pybda-config.config local > job
grep -i spark-submit job

> Submitting job spark-submit --master local --driver-memory=3G --executor-memory=5G
>                             pybda/factor_analysis.py 5
>                             single_cell_imaging_data.tsv feature_columns.tsv
>                             results/factor_analysis
> Submitting job spark-submit --master local --driver-memory=3G --executor-memory=5G
>                             pybda/kmeans.py 50,100,110,120,130,140,150,160,170,180,190,200
>                             results/factor_analysis.tsv feature_columns.tsv results/kmeans
The output shows that our application consists of two calls. One being the dimension reduction, the other being the clustering.
How can I find out what went wrong with the algorithm?
Every method or algorithm creates a log file suffixed with *.log. Having a look
at the log should make clear if errors and what kind of errors happened.
How can I find out if snakemake ran properly?
Snakemake produces a hidden folder called .snakemake/log within the directory from
which you call an application. The log files keep track what Snakemake is executing.
